The Consumer-Well-Being Survey is a standardized survey that have been administered for many communities in the U.S. and other countries to assess the level of consumer well-being.
The Theoretical Model
Description
Conducting the Survey
The Survey Report
Project Fee
The Theoretical Model Underlying the Survey
The nomological (predictive) validity of the Lee et al. (2002) measure was demonstrated by showing that satisfaction with acquisition, possession, and consumption can significantly predict life satisfaction (controlling for satisfaction with other life domains such as satisfaction with job, financial situation, health, education, friendships, leisure, neighborhood, community, and spiritual). The study employed a convenience sample of college students (N = 298). The same study failed to support the nomological validity of the CWB measure in relation to maintenance and disposal experiences. The argument that Lee et al. used to link CWB dimensions with life satisfaction is based on a bottom-up theory of life satisfaction popular in quality-of-life studies (see Diener 1984; Diener et al. 1999; Sirgy 2002 for reviews of the literature of this research). Bottom-up theory states that overall life satisfaction is determined mostly by positive and negative affect invested in the various life domains (e.g., family life, work life, leisure life, spiritual life, love life, community life, and financial life). These life domains are psychological spheres that segment affective and cognitive experiences related to interrelated life concerns (e.g., Andrews and Withey 1976; Campbell, Converse, and Rodgers 1976; Cummins et al. 1994; Frisch 1992). Marketplace experiences related to product acquisition, preparation, use, ownership, maintenance, and disposal play a direct role in meeting certain needs within the various life domains, which in turn contribute to the positive and negative affect invested in those domains. Thus, CWB contributes overall life satisfaction through feelings of satisfaction/dissatisfaction captured in various life domains.
See exact items of the Consumer-Well-Being measure and other model constructs shown in the figure in the actual online survey questionnaire in the survey.

References
Lee, D. J., & Sirgy, M. J. (2011). Consumer well-Being (CWB): Various conceptualizations and measures. In Handbook of Social Indicators and Quality of Life Research (pp. 331-354). Dordrecht: Springer Netherlands. https://doi.org/10.1007/978-94-007-2421-1_15
Lee, D. J., Sirgy, M. J., Larsen, V., & Wright, N. D. (2002). Developing a subjective measure of consumer well-being. Journal of Macromarketing, 22(2), 158-169.
Sirgy, M. J., & Lee, D. J. (2006). Macro measures of consumer well-being (CWB): A critical analysis and a research agenda. Journal of Macromarketing, 26(1), 27-44.
Sirgy, M. J., Lee, D. J., & Rahtz, D. (2007). Research on consumer well-being (CWB): Overview of the field and introduction to the special issue. Journal of Macromarketing, 27(4), 341-349. https://doi.org/10.1177/0276146707307212
Sirgy, M. J., Lee, D. J., Grzeskowiak, S., Chebat, J. C., Herrmann, A., Hassan, S., Hegazi, I., Ekici, A., Webb, D., Su, C., & Montana, J. (2008). An Extension and Further Validation of a Community-Based Consumer Well-Being Measure. Journal of Macromarketing, 28(3), 243-257.
Bibliography
Andrews Frank, M., & Withey, S. B. (1976). Social Indicators of Well-Being Americas Perception of Quality of Life.
Besser, T. L., Recker, N., & Agnitsch, K. (2008). The impact of economic shocks on quality of life and social capital in small towns. Rural Sociology, 73(4), 580-604. https://doi.org/10.1526/003601108786471530
Bollen, K. A. (1989). Structural equations with latent variables (Vol. 210). John Wiley & Sons.
Bollen, K., & Lennox, R. (1991). Conventional wisdom on measurement: A structural equation perspective. Psychological Bulletin, 110(2), 305.
Campbell, A., Converse, P. E., & Rodgers, W. L. (1976). The quality of American life: Perceptions, evaluations, and satisfactions. Russell Sage Foundation.
Cummins, R. A., McCabe, M. P., Romeo, Y., & Gullone, E. (1994). The Comprehensive Quality-of-Life Scale (COMQOL)-instrument development and psychometric evaluation on college staff and students. Educational and Psychological Measurement, 54(2), 372-382.
Day, R. L. (1978). Beyond social indicators: Quality of life at the individual level. Marketing and the Quality of Life, 1.
Day, R. L. (1987). Relationships between life satisfaction and consumer satisfaction. Marketing and Quality-of-Life Interface, 289-311.
Diener, E. (1984). Subjective well-being. Psychological Bulletin, 95(3), 542.
Diener, E., Suh, E. M., Lucas, R. E., & Smith, H. L. (1999). Subjective well-being: Three decades of progress. Psychological Bulletin, 125(2), 276.
Dogra, N., Nasir, M., & Adil, M. (2023). Does shopping values influence consumers’ well-being: empirical evidence from e-retail. International Journal of Retail & Distribution Management, 51(12), 1698-1718. https://doi.org/10.1108/IJRDM-03-2023-0167
Douglas, S. P., Craig, C. S. (1983). International Marketing Research. United Kingdom: Prentice-Hall.
Ekici, A., Joseph Sirgy, M., Lee, D. J., Yu, G. B., & Bosnjak, M. (2018). The effects of shopping well-being and shopping ill-being on consumer life satisfaction. Applied Research in Quality of Life, 13, 333-353. https://doi.org/10.1007/s11482-017-9524-9
El Hedhli, K., Becheur, I., Zourrig, H., & Chaouali, W. (2021). Shopping well-being: the role of congruity and shoppers’ characteristics. Journal of Consumer Marketing, 38(3), 293-304. https://doi.org/10.1108/JCM-07-2020-3943
El Hedhli, K., Chebat, J. C., & Sirgy, M. J. (2013). Shopping well-being at the mall: Construct, antecedents, and consequences. Journal of Business Research, 66(7), 856-863. https://doi.org/10.1016/j.jbusres.2011.06.011
El Hedhli, K., Zourrig, H., & Chebat, J. C. (2016). Shopping well-being: Is it just a matter of pleasure or doing the task? The role of shopper’s gender and self-congruity. Journal of Retailing and Consumer Services, 31, 1-13. https://doi.org/10.1016/j.jretconser.2016.03.002
Frisch, M. B. (1992). Use of the Quality of Life Inventory in problem assessment and treatment planning for cognitive therapy of depression. In Comprehensive Casebook of Cognitive Therapy (pp. 27-52). Boston, MA: Springer US.
Ganglmair-Wooliscroft, A., & Lawson, R. (2011). Subjective well-being of different consumer lifestyle segments. Journal of Macromarketing, 31(2), 172-183. https://doi.org/10.1177/0276146710393251
Homburg, C., Workman Jr, J. P., & Jensen, O. (2002). A configurational perspective on key account management. Journal of Marketing, 66(2), 38-60.
Iyer, R., & Muncy, J. A. (2016). Attitude toward consumption and subjective well‐being. Journal of Consumer Affairs, 50(1), 48-67. https://doi.org/10.1111/joca.12079
Jarvis, C. B., MacKenzie, S. B., & Podsakoff, P. M. (2003). A critical review of construct indicators and measurement model misspecification in marketing and consumer research. Journal of Consumer Research, 30(2), 199-218.
Martin, K. D., & Paul Hill, R. (2012). Life satisfaction, self-determination, and consumption adequacy at the bottom of the pyramid. Journal of Consumer Research, 38(6), 1155-1168. https://doi.org/10.1086/661528
Lee, M. S., & Ahn, C. S. Y. (2016). Anti‐consumption, materialism, and consumer well‐being. Journal of Consumer Affairs, 50(1), 18-47. https://doi.org/10.1111/joca.12089
Leelanuithanit, O., Day, R., & Walters, R. (1991). Investigating the relationship between marketing and overall satisfaction with life in a developing country. Journal of Macromarketing, 11(1), 3-23.
Leong, S. M., Ang, S. H., Cote, J. A., Lee, Y. H., & Houston, M. J. (2016). What is consumer well-being to Asians?. Social Indicators Research, 126, 777-793. https://doi.org/10.1007/s11205-015-0902-0
Malhotra, N. K. (2006). Consumer well-being and quality of life: An assessment and directions for future research. Journal of Macromarketing, 26(1), 77-80. https://doi.org/10.1177/0276146705285970
Mason, C. H., & Perreault Jr, W. D. (1991). Collinearity, power, and interpretation of multiple regression analysis. Journal of Marketing Research, 28(3), 268-280.
McCrea, R., Shyy, T. K., & Stimson, R. (2006). What is the strength of the link between objective and subjective indicators of urban quality of life?. Applied Research in Quality of Life, 1, 79-96. https://doi.org/10.1007/s11482-006-9002-2
Mohammad Shafiee, M., & Es-Haghi, S. M. S. (2017). Mall image, shopping well-being and mall loyalty. International Journal of Retail & Distribution Management, 45(10), 1114-1134. https://doi.org/10.1108/IJRDM-10-2016-0193
Nakano, N. (1991). Toward consumer well-being: Consumer socialization effects of work experience. University of Wisconsin–Madison.
Pancer, E., & Handelman, J. (2012). The evolution of consumer well‐being. Journal of Historical Research in Marketing, 4(1), 177-189. https://doi.org/10.1108/17557501211195118
Ogunmokun, O. A., Unverdi‐Creig, G. I., Said, H., Avci, T., & Eluwole, K. K. (2021). Consumer well‐being through engagement and innovation in higher education: A conceptual model and research propositions. Journal of Public Affairs, 21(1), e2100. https://doi.org/10.1002/pa.2100
Sirgy, M. J. (2001). Handbook of quality-of-life research: An ethical marketing perspective (Vol. 8). Springer Science & Business Media.
Sirgy, M. J. (2002). The psychology of quality of life (Vol. 12). Dordrecht: Kluwer Academic Publishers.
Sirgy, M. J., & Cornwell, T. (2001). Further validation of the Sirgy et al.’s measure of community quality of life. Social Indicators Research, 56, 125-143.
Sirgy, M. J., Rahtz, D. R., Cicic, M., & Underwood, R. (2000). A method for assessing residents’ satisfaction with community-based services: a quality-of-life perspective. Social Indicators Research, 49, 279-316.
Sirgy, M. J., Rahtz, D., & Lee, D.J. (Eds.). (2005). Community quality-of-life indicators: Best cases I. Dordrecht, the Netherlands: Kluwer Academic.
Sirgy, M. J., Rahtz, D., & Swain, D. (Eds.). (2006). Community quality-of-life indicators: Best cases II. Dordrecht, the Netherlands: Springer.
Xiao, J. J., & Xiao, J. J. (2015). Consumer Economic Wellbeing (pp. 3-21). Springer New York.
Description of the Survey
 |
I. ACQUISITION (SHOPPING) SATISFACTION malls, shopping plazas and centers, department stores, grocery stores, etc. |
II. PREPARATION (ASSEMBLY) consumer electronics, furniture, appliances, transportation, clothing, tools |
| III. CONSUMPTION (USE) SATISFACTION consumer good, consumer services |
IV. POSSESSION (OWNERSHIP) SATISFACTION consumer goods, real estate, boat and other leisure investments |
|
| V. MAINTENANCE (REPAIR) SATISFACTION consumer electronics, furniture, appliances, transportation, clothing, tools |
VI. DISPOSAL SATISFACTION consumer electronics, furniture, appliances, transportation, clothing, tools |
|
| VII. LIFE DOMAIN SATISFACTION work, finance, health, education, social life, leisure, spiritual life, culture, social status |
VIII. LIFE SATISFACTION life in general |
|
| IX. DEMOGRAPHICS age, gender, marital status, full-time vs. part-time employment, etc. |
People are introduced to the survey questionnaire via an email describing the objectives of the survey as aiming to assess the consumer well-being in their community. Participants are assured that their responses would remain confidential and anonymous.
The questionnaire consists of three major sections. The first section involves the core consumer-well-being survey items. See exact items of this construct in the actual online survey questionnaire.
The second section focuses on measures of satisfaction with various life domains and life overall. See exact items of these constructs in the actual online survey questionnaire.
The last (third) section of the questionnaire contains demographic questions related to gender, age, educational level, years of service in current type of work, and years of service.
Conducting the Survey
The Management Institute for Quality-of-Life Studies (MIQOLS) provides assistance in conducting the Consumer-Well-Being Survey (online). The Consumer-Well-Being Survey is first adapted to the exact specification of the community in question. The adapted version of the Consumer-Well-Being Survey is then posted on MIQOLS website for data collection. The client publicizes a call to their citizens to complete the online survey anonymously and confidentially. A link is provided with the call to complete the survey with a specific deadline.
After the deadline, the survey site is closed, data analyzed, and a report is issued to the client college or university. To see an example of a typical report, see the Consumer-Well-Being Survey Report below.
The Theoretical Model
Description
Conducting the Survey
The Survey Report
Project Fee
The Theoretical Model Underlying the Survey
Shopping Wellbeing
There are many positive aspects inherent in shopping. The most important of these is the utility of shopping. Individuals shop to acquire goods and services to satisfy their personal and family needs. That is, shopping is instrumental to achieving higher goals. A person may visit the grocery store every day to help fix dinner for her/his family. Such is the utilitarian function of shopping and much research has documented that the need satisfaction effects of this activity. For example, the extent to which stores and shopping centers and malls contribute to shoppers’ satisfaction and perceived quality of life (i.e., life satisfaction) is partly based on the functional aspects of stores and other outlets in providing desired goods and services at acceptable levels of quality and price (e.g., El-Hedhli et al. 2013; Sirgy et al. 2008; Meadow and Sirgy 2008).
Past research also indicates that shopping contributes to the well-being of individuals by creating hedonic enjoyment and satisfaction of self-expressive needs. Specifically, retail scholars have argued that shopping is associated with hedonic value (e.g., Arnold and Reynolds 2012), excitement and delight (e.g., Oliver et al. 1997; Wakefield and Baker 1998), and enjoyment (e.g., Beatty and Ferrell 1998). Shopping activities have been described as a form of Brecreation^ (e.g., Backstrom 2006; Guiry et al. 2006), entertainment (e.g., Moss 2007), and an activity that creates emotional arousal and joy (e.g., Jin and Sternquist 2004; Pooler 2003). Additionally, researchers over the past decade have explored the idea that marketplace activities (i.e., shopping) may help individuals express themselves (e.g., Sirgy et al. 2016). As a result, it is possible to argue that shopping activities are not only hedonically enjoyable but also self expressive in that individuals express their own personal identity through shopping. This involvement, in turn, may serve to actualize the individual’s potential in meeting role expectations such as being a good mother/father, wife/husband, etc.
Shopping well-being is defined as perceptions that shopping contributes to the overall quality of life of oneself and one’s family. How does shopping contribute to subjective well-being? There is at least one major theory that can explain this effect, namely bottom-up spillover theory of life satisfaction. Bottom-up spillover theory of life satisfaction has been frequently used in quality-of-life studies to explain the effect of situational events on life satisfaction. The original proponents of this theory are Andrews and Withey (1976) and Campbell et al. (1976) (see review in Sirgy 2012 for a detailed discussion of the theory). Bottom-up spillover theory proposes that overall life satisfaction is mostly determined by positive and negative experiences in important life domains. Specifically, life satisfaction is heavily influenced by satisfaction in salient life domains (i.e., overall satisfaction in work life, family life, social life, residential life, material life, etc.). Specific events influence life satisfaction by contributing positive and negative affect in specific life domains in a context of satisfaction hierarchy. For example, positive and negative experiences in the marketplace activities (i.e., shopping) influence life satisfaction by influencing overall satisfaction in work life, family life, social life, residential life, 336 Ekici A. et al. material life, etc. Consider the following example: A traditional woman playing the roles of mother and wife shops for goods and services to take care of her family needs and daily functioning. A shopping event that contributes successfully to her family needs and daily functioning produces positive affect in several life domains as a direct function of the nature of those goods and services purchased. Shopping for food/beverage items to fix tonight’s dinner is likely to contribute positively to satisfaction in family life; whereas, shopping for food/beverage items to host a social event for the upcoming weekend is likely to contribute positively to satisfaction in social life. Bottom-up spillover theory has been used widely in the literatures of consumer behavior, public policy, and macromarketing (see literature reviews in Andreasen et al. 2011; Sirgy 2008; Sirgy and Lee 2006; Sirgy et al. 2007).
Shopping Illbeing
Even though some researchers have studied the positive consequences of shopping (i.e., shopping well-being), many others have focused on the dark-side of shopping. For example, research has linked shopping to compulsive behavior adversely impacting individuals’ quality of life (e.g., Roberts et al. 2005). In addition, some retailing scholars have pointed out the negative impact of shopping when individuals perceive shopping as work or a Bnecessary evil^ (e.g., Babin et al. 1994).
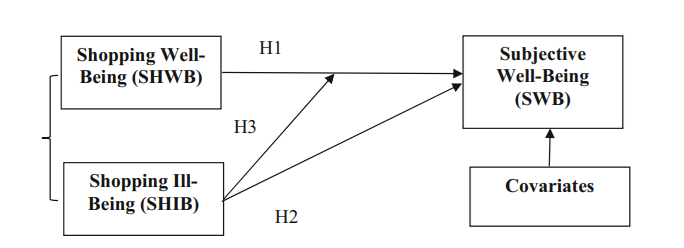
It is possible to imagine situations where shopping would result in decreased life satisfaction, particularly when the individual spends too much time, energy, and money on shopping at the expense of meeting other role expectations in other life domains (e.g. family life, financial life, work life, leisure life, social life). As such, shopping illbeing is defined as perceptions that one spends too much time, effort, and money in shopping activities as reflected by complaints from family members, friends, and coworkers about one’s shopping. In other words, resources (time, money, and effort) an individual invests in shopping may come at the expense of time, money, and effort required to meet role expectations in other life domains. Meeting these role expectations in other life domains is vital in maintaining a certain level of life satisfaction. This overspending (time, money, and effort) on shopping generally results in complaints among family members, relatives/friends, and/or people at work. These complaints reflect failure to meet role expectations, which in turn, contribute to a significant amount of dissatisfaction in life domains related to family life, social life, work life, and financial life.
The hypothesis of the negative relationship between shopping ill-being and life satisfaction is consistent with past research (e.g., Ridgeway et al. 2008). Compulsive buying may result in numerous negative consequences, such as financial problems, emotional harm (e.g., negative feelings, feelings of guilt), and social and relationship problems (Faber and O’Guinn 1992). Spending too much time on shopping may detract from opportunities to engage in other activities that can enhance the sense of social well-being, family well-being, work well-being, etc. Furthermore, spending too much money on material acquisition is likely to lead to financial debt, which may take away Consumer Life Satisfaction 337 from spending on other goods and services essential to social well-being, family wellbeing, work well-being, etc.
Similarly, the notion that shopping ill-being detracts from life satisfaction can be supported by role demand and resources theory (e.g., Voydanoff 2005), a theory wellestablished in the work-life balance literature. That is, individuals use much resources in meeting role demand at work and in family life. Resources (time, energy, and money) are limited. As such, resources used in work life may come at the expense of resources used in family life, social life, etc. The same argument can be applied to shopping life. Resources used in shopping may come at the expense of resources that can be used to enhance satisfaction in other life domains such as family life, social life, work life, spiritual life, etc.
To see the exact items of the measure and other model constructs check the actual online survey questionnaire in the survey.
References
Ekici, A., Joseph Sirgy, M., Lee, D. J., Yu, G. B., & Bosnjak, M. (2018). The effects of shopping well-being and shopping ill-being on consumer life satisfaction. Applied Research in Quality of Life, 13(2), 333-353.
Bibliography
Bhardwaj, P., & Kalro, A. D. (2024). Consumer well‐being—A systematic literature review and research agenda using TCCM framework. International Journal of Consumer Studies, 48(1), e12991.
Dogra, N., Nasir, M., & Adil, M. (2023). Does shopping values influence consumers’ well-being: empirical evidence from e-retail. International Journal of Retail & Distribution Management, 51(12), 1698-1718.
Jain, A., Srivastava, D. S., & Shukla, A. (2023). Self-control and compulsive buying behavior: The mediating role of ill-being perception. Cogent Business & Management, 10(3), 2286673.
Maggioni, I., Sands, S., Kachouie, R., & Tsarenko, Y. (2019). Shopping for well-being: The role of consumer decision-making styles. Journal of Business Research, 105, 21-32.
Nanda, A. P., Banerji, D., & Singh, N. (2023). Situational factors of compulsive buying and the well-being outcomes: what we know and what we need to know. Journal of Macromarketing, 43(3), 384-402.
Nghia, H. T., Olsen, S. O., & Trang, N. T. M. (2020). Shopping value, trust, and online shopping well-being: a duality approach. Marketing Intelligence & Planning, 38(5), 545-558.
Nghia, H. T., Olsen, S. O., & Trang, N. T. M. (2022). A dual process on shopping well-being across shopping contexts: the role of shopping values and impulse buying. Asia Pacific Journal of Marketing and Logistics, 34(3), 594-610.
Ni, S., & Ishii, K. (2019). The influence of shopping on subjective well-being in China: Tradition-directedness and trust as moderators. Asia Pacific Journal of Marketing and Logistics, 31(1), 184-201.
Olsen, S. O., Khoi, N. H., & Tuu, H. H. (2022). The “well-being” and “ill-being” of online impulsive and compulsive buying on life satisfaction: The role of self-esteem and harmony in life. Journal of Macromarketing, 42(1), 128-145.
Sirgy, M. J. (2021). Macromarketing metrics of consumer well-being: An update. Journal of Macromarketing, 41(1), 124-131.
Description of the Survey
|
|
I. SHOPPING ILLBEING time overspent, money overspent, energy overspent |
II. SHOPPING WELLBEING personal wellbeing, life satisfaction, quality of life, happiness |
| III. LIFE DOMAIN SATISFACTION work, finance, health, education, social life, leisure, spiritual life, culture, social status |
IV. LIFE SATISFACTION life in general |
|
| V. DEMOGRAPHICS age, gender, marital status, full-time vs. part-time employment, etc. |
People are introduced to the survey questionnaire via an email describing the objectives of the survey as aiming to assess the consumer well-being in their community. Participants are assured that their responses would remain confidential and anonymous.
The questionnaire consists of three major sections. The first section involves the core survey items. See exact items of this construct in the actual online survey questionnaire.
The second section focuses on measures of satisfaction with various life domains and life overall. See exact items of these constructs in the actual online survey questionnaire.
The last (third) section of the questionnaire contains demographic questions related to gender, age, educational level, years of service in current type of work, and years of service.
Conducting the Survey
The Management Institute for Quality-of-Life Studies (MIQOLS) provides assistance in conducting the survey (online). The survey is first adapted to the exact specification of the community in question. The adapted version of the survey is then posted on MIQOLS website for data collection. The client publicizes a call to their citizens to complete the online survey anonymously and confidentially. A link is provided with the call to complete the survey with a specific deadline.
After the deadline, the survey site is closed, data analyzed, and a report is issued to the client college or university. To see an example of a typical report, see the example report below.
The Theoretical Model
Description
Conducting the Survey
The Survey Report
Project Fee
The Theoretical Model Underlying the Survey
Much of the research to date on mall image in retailing is predicated on the research involving store image. Store image is a concept that reflects shoppers’ perception of a store in terms of functional and psychological attributes (e.g., Martineau, 1958; Mazursky and Jacoby, 1986). Functional attributes are store characteristics regarded as concrete, tangible, and observable (e.g., assortment of the store’s merchandising, the hours of operation, the location of the store in proximity to residential neighborhoods and work places, and parking space relative to the traffic generated by the store). In contrast, psychological attributes are store characteristics that are abstract, intangible, and not directly observable (e.g., the store’s atmospherics [ambience] and the shoppers’ image of the typical people that patronize the store). The concept of store image has been empirically documented in an impressive number of studies (e.g., Arons, 1961; Bearden, 1977; Chebat et al., 2006; Darden and Babin, 1994; Hansen and Deutscher, 1977; James et al., 1976; Kunkel and Berry, 1968; Marks, 1976; Mazursky and Jacoby, 1986; Oxenfeldt, 1974–75; Schiffman et al., 1977; Sirgy et al., 2000). Recent studies have focused on the impact of store image on product perception (D’Astous and Gargouri, 2001), store satisfaction, store commitment, word-of-mouth, purchase intentions, and price insensitivity (Bloemer and OderkerkenSchroder, 2002), and store loyalty (D’Astous and Lévesque, 2003).
Also recently, Ailawadi and Keller (2004) proposed that the conceptualization and measurement of store image can be improved by capturing five key dimensions: access, atmosphere, price and promotion, cross-category assortment, and within-category assortment. Access refers to the location of the store and the distance that shoppers must travel to shop there. Stores that are easily accessible to shoppers are perceived more favorably and are likely to be patronized more than stores that are less accessible. Atmosphere refers to the aesthetics and ambiance of the store. Elements of the in-store environment such as color, music, and crowding reflect the store atmosphere. Ideally, stores should be perceived to be pleasant and moderately arousing. Stores with pleasant and moderately arousing atmospheres are likely to contribute to the overall favorableness of the store, which in turn should increase store patronage. With respect to price and promotion, shopper’s overall attitude toward a store (and their patronage of that store) is also influenced by their perception of the average level of prices, variations of prices over time, and the frequency and depth of the store’s promotion. In other words, shoppers hold favorable attitudes toward a store (and likely to patronize that store) if that store is perceived to have acceptable prices, those prices do not vary significantly over time, and that the store offers shoppers many promotion opportunities. Cross-category assortment refers to shoppers’ perceptions of the breadth of different products and services offered by a store under one roof. Stores perceived having higher levels of cross-category assortments are favored more than stores with lower levels. Stores with higher-levels of cross-category assortments are favored more because they offer shoppers convenience and ease of shopping. Finally, within-category assortment refers to the depth of a store’s assortment within a product category. Depth here may involve greater assortment of brands, flavors, and sizes. Stores with higher levels of within-category assortment are more likely to satisfy shoppers’ needs in relation to a particular product or service. Such satisfaction enhances shoppers’ evaluation of the store, which in turn contributes to higher levels of patronage.
Ailawadi and Keller’s store-image dimensions may equally apply to shopping malls. Access in the context of malls (rather than stores) refers to the location of the mall that shoppers must travel to. Malls located in areas highly accessible to shoppers are likely to be perceived more favorably than malls that are less accessible. Recently, using a qualitative mean-end chain analysis, Wanger (2007) found that consumers perceive a convenient shopping experience as a means to obtain physical and mental balance contributing to contentment and shopping enjoyment (cf. Ahmed et al., 2007; Leo and Phillipe, 2002; Nicholls, et al., 2003).
Atmosphere in the context of malls refers to aesthetics and ambiance of the mall. Again, the mall’s environment such as color, music, and crowding play an important in shoppers’ perception and evaluation of the mall at large. Malls perceived to have a pleasant and moderately arousing atmosphere are likely to be more favored by shoppers than those with less pleasant atmosphere. Similarly, malls that are moderately arousing are likely to be more favored than malls that are perceived to be highly arousing or not arousing at all. There is much evidence in the retailing literature to support the notion that mall atmosphere is an important factor in mall evaluation, patronage, and loyalty (e.g., Andreu, et al., 2006; Babin and Attaway, 2000; Grewal, et al., 2003; Keng, et al., 2007; Michon et al., 2005; Michon et al., 2007, 2008).
Malls perceived to have stores with acceptable prices are likely to be favored by shoppers than malls with stores having unacceptable prices. Similarly, malls that engage in promotions to offer shoppers more store bargains are favored than malls that do not engage in such promotions. Much evidence exists supporting the effect of prices and promotion on shoppers’ behavioral responses (e.g., Leo and Phillipe, 2002; Parsons, 2003; Yavas, 2001, 2003).
Malls with a variety of store assortments are likely to be more favored than malls with less store assortment. Again, shoppers look for ease and convenience in shopping. Patronizing a mall with a greater store assortment is likely to satisfy shoppers’ needs more so than malls with lower store assortment. This is essentially the cross-category assortment. Finally, malls with higher levels of within-category assortment are likely to be more favored than malls with lower levels of within-category assortment. This means that within a certain type of store (i.e., shoe stores, jewelry stores, electronic stores), malls that offer a variety are likely to be perceived more favorably than malls that do not offer such variety. This is because shoppers who go to a mall to buy, let’s say a piece of jewelry, are more likely to find what they are looking for if the mall houses a variety of jewelry stores than if it houses only one jewelry store. Again, there is sufficient evidence that cross- and within-category assortment in malls influence shoppers behavioral responses (e.g., Balazs, 1995; Brown 1992; Nicholls et al., 2002; Yavas, 2001).
This concept of mall image is captured in the figure below. The figure also shows how this conceptualization (and operationalization) of mall image predicts mall attitude, mall patronage, and word-of-mouth communication. The five dimensions of the mall image (access, atmosphere, price/promotion, cross-category assortment, and within-category assortment) predict shopper behavior in terms of mall attitude, mall patronage, and word-of-mouth communications. In other words, a mall characterized as high in terms of access, atmosphere, price/promotion, cross-category assortment, and within-category assortment should also be positively evaluated by shoppers, and that the same shoppers should patronize that mall more frequently and refer that mall to their friends and family members more so than a mall perceived as low on the same dimensions.

References
Chebat, J. C., Sirgy, M. J., & Grzeskowiak, S. (2010). How can shopping mall management best capture mall image?. Journal of business Research, 63(7), 735-740.
Bibliography
Amin, M., Ryu, K., Cobanoglu, C., Rezaei, S., & Wulan, M. M. (2021). Examining the effect of shopping mall attributes in predicting tourist shopping satisfaction and behavioral intentions: Variation across generation X and Y. Journal of Quality Assurance in Hospitality & Tourism, 22(3), 367-394.
Bhatnagar, A., & Syam, S. S. (2014). Allocating a hybrid retailer’s assortment across retail stores: Bricks-and-mortar vs online. Journal of business Research, 67(6), 1293-1302.
Calvo-Porral, C., & Lévy-Mangín, J. P. (2018). Pull factors of the shopping malls: an empirical study. International Journal of Retail & Distribution Management, 46(2), 110-124.
Calvo-Porral, C., & Lévy-Mangin, J. P. (2019). Profiling shopping mall customers during hard times. Journal of Retailing and Consumer Services, 48, 238-246.
Cho, J. Y., & Lee, E. J. (2017). Impact of interior colors in retail store atmosphere on consumers’ perceived store luxury, emotions, and preference. Clothing and Textiles Research Journal, 35(1), 33-48.
Dębek, M. (2015). What drives shopping mall attractiveness. Polish Journal of Applied Psychology, 13(1), 67-118.
Djelassi, S., Godefroit-Winkel, D., & Diallo, M. F. (2018). Does culture affect the relationships among utilitarian and non-utilitarian values, satisfaction and loyalty to shopping centres? Evidence from two Maghreb countries. International Journal of Retail & Distribution Management, 46(11/12), 1153-1169.
El Hedhli, K., Zourrig, H., & Chebat, J. C. (2016). Shopping well-being: Is it just a matter of pleasure or doing the task? The role of shopper’s gender and self-congruity. Journal of Retailing and Consumer Services, 31, 1-13.
El Hedhli, K., Zourrig, H., & Park, J. (2017). Image transfer from malls to stores and its influence on shopping values and mall patronage: The role of self-congruity. Journal of Retailing and Consumer Services, 39, 208-218.
Elmashhara, M. G., & Soares, A. M. (2022). Linking atmospherics to shopping outcomes: The role of the desire to stay. Journal of Retailing and Consumer Services, 64, 102744.
Garrouch, K., & Ghali, Z. (2023). On linking the perceived values of mobile shopping apps, customer well-being, and customer citizenship behavior: Moderating role of customer intimacy. Journal of Retailing and Consumer Services, 74, 103396.
Gilboa, S., Vilnai-Yavetz, I., Mitchell, V., Borges, A., Frimpong, K., & Belhsen, N. (2020). Mall experiences are not universal: The moderating roles of national culture and mall industry age. Journal of Retailing and Consumer services, 57, 102210.
Gomes, R. M., & Paula, F. (2017). Shopping mall image: systematic review of 40 years of research. The International Review of Retail, Distribution and Consumer Research, 27(1), 1-27.
Han, H., Sahito, N., Thi Nguyen, T. V., Hwang, J., & Asif, M. (2019). Exploring the features of sustainable urban form and the factors that provoke shoppers towards shopping malls. Sustainability, 11(17), 4798.
Khare, A., Achtani, D., & Khattar, M. (2014). Influence of price perception and shopping motives on Indian consumers’ attitude towards retailer promotions in malls. Asia Pacific Journal of Marketing and Logistics, 26(2), 272-295.
Khare, A., Awasthi, G., & Shukla, R. P. (2020). Do mall events affect mall traffic and image? A qualitative study of Indian mall retailers. Asia Pacific Journal of Marketing and Logistics, 32(2), 343-365.
Krasonikolakis, I., & Vrontis, D. (2022). A systematic literature review of store atmosphere in alternative retail commerce channels. Journal of Business Research, 153, 412-427.
Krey, N., Picot-Coupey, K., & Cliquet, G. (2022). Shopping mall retailing: A bibliometric analysis and systematic assessment of Chebat’s contributions. Journal of retailing and consumer services, 64, 102702.
Lu, J., Zheng, X., Nervino, E., Li, Y., Xu, Z., & Xu, Y. (2024). Retail store location screening: A machine learning-based approach. Journal of Retailing and Consumer Services, 77, 103620.
Maggioni, I., Sands, S., Kachouie, R., & Tsarenko, Y. (2019). Shopping for well-being: The role of consumer decision-making styles. Journal of Business Research, 105, 21-32.
Makgopa, S. (2016). Determining consumers’ reasons for visiting shopping malls. Innovative Marketing, 12(2), 22-27.
Makgopa, S. S. (2018). Determining shopping malls customers’ satisfaction and loyalty. Journal of Business and Retail Management Research, 13(01).
Merrilees, B., Miller, D., & Shao, W. (2016). Mall brand meaning: an experiential branding perspective. Journal of Product & Brand Management, 25(3), 262-273.
Mohammad Shafiee, M., & Es-Haghi, S. M. S. (2017). Mall image, shopping well-being and mall loyalty. International Journal of Retail & Distribution Management, 45(10), 1114-1134.
Ortegón-Cortázar, L., & Royo-Vela, M. (2017). Attraction factors of shopping centers: Effects of design and eco-natural environment on intention to visit. European Journal of Management and Business Economics, 26(2), 199-219.
Roy, S. K., Shekhar, V., Quazi, A., & Quaddus, M. (2020). Consumer engagement behaviors: do service convenience and organizational characteristics matter?. Journal of Service Theory and Practice, 30(2), 195-232.
Sirgy, M. J. (2018). Self-congruity theory in consumer behavior: A little history. Journal of Global Scholars of Marketing Science, 28(2), 197-207.
Teller, C., & Schnedlitz, P. (2012). Drivers of agglomeration effects in retailing: The shopping mall tenant’s perspective. Journal of Marketing Management, 28(9-10), 1043-1061.
Thanasi-Boçe, M., Kwiatek, P., & Labadze, L. (2021). The importance of distance and attraction in patronizing a shopping mall. Journal of Place Management and Development, 14(2), 222-238.
Troiville, J. (2024). Connecting the dots between brand equity and brand loyalty for retailers: The mediating roles of brand attitudes and word-of-mouth communication. Journal of Business Research, 177, 114650.
Troiville, J., Hair, J. F., & Cliquet, G. (2019). Definition, conceptualization and measurement of consumer-based retailer brand equity. Journal of Retailing and Consumer Services, 50, 73-84.
Wei Khong, K., & Sim Ong, F. (2014). Shopper perception and loyalty: a stochastic approach to modelling shopping mall behaviour. International Journal of Retail & Distribution Management, 42(7), 626-642.
Description of the Survey
|
|
I. MALL ACCESS location, convenience |
II. MALL ATMOSPHERE atmosphere |
| III. PRICE / PROMOTION product value, product awareness |
IV. CROSS CATEGORY ASSORTMENT store selection, store stock, specialty store, departments |
|
| V. WITHIN CATEGORY ASSORTMENT product styles, new products, available products, brand names |
VI. MALL ATTITUDE feelings about mall |
|
| VII. MALL PATRONAGE frequency of visits |
VIII. WORD OF MOUTH COMMUNICATION recommendation |
|
| IX. LIFE DOMAIN SATISFACTION work, finance, health, education, social life, leisure, spiritual life, culture, social status |
X. LIFE SATISFACTION life in general |
|
| XI. DEMOGRAPHICS age, gender, marital status, full-time vs. part-time employment, etc. |
People are introduced to the survey questionnaire via an email describing the objectives of the survey as aiming to assess the consumer well-being in their community. Participants are assured that their responses would remain confidential and anonymous.
The questionnaire consists of three major sections. The first section involves the core survey items. See exact items of this construct in the actual online survey questionnaire.
The second section focuses on measures of satisfaction with various life domains and life overall. See exact items of these constructs in the actual online survey questionnaire.
The last (third) section of the questionnaire contains demographic questions related to gender, age, educational level, years of service in current type of work, and years of service.
Conducting the Survey
The Management Institute for Quality-of-Life Studies (MIQOLS) provides assistance in conducting the survey (online). The survey is first adapted to the exact specification of the community in question. The adapted version of the survey is then posted on MIQOLS website for data collection. The client publicizes a call to their citizens to complete the online survey anonymously and confidentially. A link is provided with the call to complete the survey with a specific deadline.
After the deadline, the survey site is closed, data analyzed, and a report is issued to the client college or university. To see an example of a typical report, see the example report below.
The Theoretical Model
Description
Conducting the Survey
The Survey Report
Project Fee
The Theoretical Model Underlying the Survey
We chose the concept of the consumer/product life cycle to ensure that we touch upon the full range of consumer experiences with the home – acquisition, preparation, possession, consumption, maintenance, and disposal. The concept of the consumer/product life cycle is very popular in the study of consumer behavior and consumer policy. As a matter of fact, many textbook authors of consumer behavior organize the entire discipline in terms of the consumer/product life cycle (e.g., Aaker and Day, 1982; Lindquist and Sirgy, 2003).
Using the concept of the consumer/product life cycle, we were able to separate meaningful interactions that the home resident experiences with the dwelling and explored how the dwelling contributes to the resident’s wellbeing. The underlying assumption of the consumer/product life cycle in relation to housing is that housing well-being can be enhanced if the dwelling is marketed in ways that delivers satisfaction across all six stages of the consumer/product life cycle (acquisition, preparation, possession, consumption, maintenance, and disposal). It has been argued that the multifaceted housing experiences prior to, during, and after consumption, all contribute to housing well-being. Since satisfaction is a dynamic process, housing satisfaction needs to be examined in the context of the entire consumption cycle (Birks and Southan, 1992). Specifically, housing wellbeing is assumed to occur when
- The home is bought with the least amount of effort (acquisition),
- The home is prepared for use to meet the needs of the new occupants (preparation),
- Ownership signals status and enhances the home owner’s financial portfolio (possession),
- The home serves the housing needs of the residents (consumption),
- The maintenance, renovation, and repair in the home are minimal, least costly, and effortless (maintenance), and
- The sale of the home is transacted with the least amount of effort and most financial gain (disposal).
Taking into account the above theoretical assumptions, we define housing well-being as follows:
Housing well-being refers to the home resident’s cumulative positive and negative affect associated with home use, maintenance, possession, purchase, preparation of the current home, and the selling (disposal) of the previous home.
Housing well-being is construed to involve both reflective and formative indicators. Reflective indicators of housing well-being focus on perceptions of the extent to which the home has positively or negatively impacted the resident’s QOL. Perception of QOL impact of the home is mostly influenced by satisfaction with home use and home ownership. In turn, satisfaction with home use is mostly influenced by satisfaction with home maintenance, neighborhood, and community. Satisfaction with home ownership also is influenced mostly by satisfaction with home maintenance and neighborhood. Satisfaction with home maintenance is mostly influenced by satisfaction with home preparation, home purchase, and neighborhood. Furthermore, satisfaction with neighborhood is mostly influenced by satisfaction with community and home purchase. Finally, satisfaction with home purchase is mostly influenced by satisfaction with home preparation and the sale of one’s previous home. These are captured in our conceptual model as shown below:

References
Grzeskowiak, S., Sirgy, M. J., Lee, D. J., & Claiborne, C. B. (2006). Housing well-being: Developing and validating a measure. Social Indicators Research, 79(3), 503-541.
Bibliography
Baer, W. C. (2014). Using housing quality to track change in the standard of living and poverty for seventeenth-century London. Historical Methods: A Journal of Quantitative and Interdisciplinary History, 47(1), 1-18.
Brzezicka, J., & Tomal, M. (2023). Estimation of the utility function of money and housing based on the cumulative prospect theory. Real Estate Management and Valuation, 31(3), 83-92.
Caffaro, F., Galati, D., & Roccato, M. (2016). Development and validation of the perception of housing quality scale (PHQS). TPM. TESTING, PSYCHOMETRICS, METHODOLOGY IN APPLIED PSYCHOLOGY, 23(1), 37-51.
Coulombe, S., Jutras, S., Labbé, D., & Jutras, D. (2016). Residential experience of people with disabilities: A positive psychology perspective. Journal of Environmental Psychology, 46, 42-54.
Grum, B., & Kobal Grum, D. (2020). Concepts of social sustainability based on social infrastructure and quality of life. Facilities, 38(11/12), 783-800.
Jagannath, S., Gatersleben, B., & Ratcliffe, E. (2024). Flexibility of the home and residents’ psychological wellbeing. Journal of Environmental Psychology, 96, 102333.
Land, K. C., Michalos, A. C., & Sirgy, M. J. (Eds.). (2011). Handbook of social indicators and quality of life research. Springer Science & Business Media.
Roazzi, A., Monteiro, C. M. G., & Rullo, G. (2009). Residential satisfaction and place attachment: a cross-cultural investigation. In Facet Theory Conference: Design, Analysis and Application in Multivariate Approaches (pp. 81-89).
Sirgy, M. J. (2008). Ethics and public policy implications of research on consumer well-being. Journal of Public Policy & Marketing, 27(2), 207-212.
Sirgy, M. J. (2016). Towards a new concept of residential well-being based on bottom-up spillover and need hierarchy theories. A Life Devoted to Quality of Life: Festschrift in Honor of Alex C. Michalos, 131-150.
Sirgy, M. J., Lee, D. J., & Rahtz, D. (2007). Research on consumer well-being (CWB): Overview of the field and introduction to the special issue. Journal of Macromarketing, 27(4), 341-349.
Smith, K. M. (2011). The relationship between residential satisfaction, sense of community, sense of belonging and sense of place in a Western Australian urban planned community.
Will, S., & Renz, T. (2023). My home is my burden? Homeownership, financial burden and subjective well-being in a unitary rental market. Applied Research in Quality of Life, 18(5), 2227-2257.
Description of the Survey
|
|
I. PERCEIVED QUALITY OF LIFE IMPACT OF HOME quality of life impact |
II. SATISFACTION WITH HOME PURCHASE search process, selection, closing, loan officer, loan process, cost |
| III. SATISFACTION WITH HOME PREPARATION design, personalization, builder, development experience, building yourself |
IV. SATISFACTION WITH HOME USE space, yard, layout, quality, amenities, appliances |
|
| V. SATISFACTION WITH NEIGHBORHOOD rules and regulations, neighborhood social life, neighborhood externalities, neighborhood problems |
VI. SATISFACTION WITH COMMUNITY infrastructure, lifestyle |
|
| VII. SATISFACTION WITH HOME MAINTENANCE ongoing maintenance requirements, home repair or renovations, yard work |
VIII. SATISFACTION WITH HOME OWNERSHIP value appreciation, financial burden, gratification of ownership |
|
| IX. SATISFACTION WITH SALE OF PREVIOUS HOME listing agent, closing, financial proceeds |
X. LIFE DOMAIN SATISFACTION work, finance, health, education, social life, leisure, spiritual life, culture, social status |
|
| XI. LIFE SATISFACTION life in general |
XII. DEMOGRAPHICS age, gender, marital status, full-time vs. part-time employment, etc. |
People are introduced to the survey questionnaire via an email describing the objectives of the survey as aiming to assess the consumer well-being in their community. Participants are assured that their responses would remain confidential and anonymous.
The questionnaire consists of three major sections. The first section involves the core survey items. See exact items of this construct in the actual online survey questionnaire.
The second section focuses on measures of satisfaction with various life domains and life overall. See exact items of these constructs in the actual online survey questionnaire.
The last (third) section of the questionnaire contains demographic questions related to gender, age, educational level, years of service in current type of work, and years of service.
Conducting the Survey
The Management Institute for Quality-of-Life Studies (MIQOLS) provides assistance in conducting the survey (online). The survey is first adapted to the exact specification of the community in question. The adapted version of the survey is then posted on MIQOLS website for data collection. The client publicizes a call to their citizens to complete the online survey anonymously and confidentially. A link is provided with the call to complete the survey with a specific deadline.
After the deadline, the survey site is closed, data analyzed, and a report is issued to the client college or university. To see an example of a typical report, see the example report below.
The Theoretical Model
Description
Conducting the Survey
The Survey Report
Project Fee
The Theoretical Model Underlying the Survey
Consumer’s perception of the quality-of-life impact (PQOLI) of a consumer durable refers to consumer’s subjective evaluation of the degree to which marketplace experiences related to the consumer durable impacts the consumer’s overall quality of life. The concept of PQOLI of consumer durable is different from the traditional construct of consumer satisfaction.
Where consumer satisfaction may be necessary for a product to improve consumers’ quality of life, it is not sufficient. For example, a consumer may be highly satisfied with a product but this product may be perceived to have little contribution to their QOL. This may be because the product-related experience is not important in a consumers’ life. The concept of PQOLI is distinct from the general consumer satisfaction construct because it captures satisfaction with those experiences that impact consumers’ life satisfaction. Such QOL-related consumption satisfaction may stem from the whole range of experiences throughout the entire consumption experience with product. That is, not only experiences related to the consumption of the product but also the ownership of the product, the maintenance of the product, as well as other marketplace experiences such as purchase, and preparation of the product for personal use.
Much of the research literature on consumer satisfaction focuses exclusively on experiences related to product purchase and consumption (e.g., Fournier and Mick 1999; Oliver 1989). Very little research focuses on the totality of the marketplace experience. This totality can be captured through consumer experiences with the product in various stages of the consumption life cycle—experiences with purchase, preparation, consumption, ownership, and maintenance. In that vein, satisfaction experienced with every facet of consumer’s interaction with the product may add to the overall satisfaction with QOL-related experiences that reflect PQOLI. In sum, Polis different from customer satisfaction because it is a macro-level concept that captures satisfaction with the entire consumption life cycle ranging from product acquisition to maintenance, whereas customer satisfaction is a more micro-level concept focusing on a particular marketplace experience, mostly product use.
Consumer’s satisfaction depends upon the facets of the consumption life cycle (purchase, preparation, consumption, ownership, and maintenance). Based on a thorough literature review, satisfaction with the purchase experience is a function of satisfaction with product options and accessibility (e.g., variety and quality of brand options), salespeople (e.g., salespeople providing valuable and accurate information, helpful in selecting the right product, pleasantness of the social interaction), financial transaction (e.g., financing options, time and effort involved, how the process was or was not emotionally draining), third party information providers (ease of finding objective information, the currency and timeliness of the objective information, the accuracy and credibility of the objective information, the financial cost of acquiring this objective information, etc.), checkout and closing (time and effort to complete the transaction, additional charges related to ordering, whether the experience was emotionally draining, etc.), and product value (e.g., product quality, product warranty, and the price paid). See the figure below:

References
Grzeskowiak, S., Lee, D. J., Yu, G. B., & Sirgy, M. J. (2014). How do consumers perceive the quality-of-life impact of durable goods? A consumer well-being model based on the consumption life cycle. Applied Research in Quality of Life, 9(3), 683-709.
Bibliography
Sirgy, M. J., Uysal, M., & Kruger, S. (2017). Towards a benefits theory of leisure well-being. Applied Research in Quality of Life, 12(1), 205-228.
Zhou, Z., Wang, R., & Zhan, G. (2022). Cultivating consumer subjective well-being through online brand communities: a multidimensional view of social capital. Journal of Product & Brand Management, 31(5), 808-822.
Description of the Survey
|
|
I. QUALITY OF LIFE IMPACT OF PRODUCT product, purchase, preparation, use, owning, upkeep and maintenance |
II. PRODUCT OPTIONS AND ACCESSIBILITY variety, quality, shopping experience |
| III. SATISFACTION WITH SALES PERSONNEL information, negotiation, social interaction |
IV. SATISFACTION WITH FINANCIAL TRANSACTION financing options |
|
| V. SATISFACTION WITH 3RD PARTY INFORMATION PROVIDERS information availability, information accuracy, information cost |
VI. SATISFACTION WITH CHECKOUT AND CLOSING time and effort, additional charges |
|
| VII. SATISFACTION WITH PRODUCT VALUE quality, warranty, price |
VIII. SATISFACTION WITH PRODUCT ASSEMBLY assembly instructions, technical support |
|
| IX. SATISFACTION WITH PRODUCT ADAPTATION customization, adjustment |
X. SATISFACTION WITH PRODUCT REGISTRATION time and effort, cost, benefits |
|
| XI. SATISFACTION WITH PRODUCT FUNCTIONAL FEATURES performance, quality, reliability, durability, ease of use, cost of use, safety |
XII. SATISFACTION WITH PRODUCT EXPERIMENTAL FEATURES aesthetics |
|
| XIII. SATISFACTION WITH PRODUCT SYMBOLIC FEATURES representation |
XIV. SATISFACTION WITH PRODUCT FINANCIAL INVESTMENT depreciation, cost, benefit |
|
| XIV. SATISFACTION WITH PRODUCT SOCIAL-PSYCHOLOGICAL VALUE status, guilt |
XIV. SATISFACTION WITH PRODUCT SELF MAINTENANCE frequency, time and effort, cost |
|
| XV. SATISFACTION WITH PRODUCT MAINTENANCE BY SERVICE PROVIDERS frequency, time and effort, cost |
XVI. LIFE DOMAIN SATISFACTION work, finance, health, education, social life, leisure, spiritual life, culture, social status |
|
| XVII. LIFE SATISFACTION life in general |
XVIII. DEMOGRAPHICS age, gender, marital status, full-time vs. part-time employment, etc. |
People are introduced to the survey questionnaire via an email describing the objectives of the survey as aiming to assess the consumer well-being in their community. Participants are assured that their responses would remain confidential and anonymous.
The questionnaire consists of three major sections. The first section involves the core survey items. See exact items of this construct in the actual online survey questionnaire.
The second section focuses on measures of satisfaction with various life domains and life overall. See exact items of these constructs in the actual online survey questionnaire.
The last (third) section of the questionnaire contains demographic questions related to gender, age, educational level, years of service in current type of work, and years of service.
Conducting the Survey
The Management Institute for Quality-of-Life Studies (MIQOLS) provides assistance in conducting the survey (online). The survey is first adapted to the exact specification of the community in question. The adapted version of the survey is then posted on MIQOLS website for data collection. The client publicizes a call to their citizens to complete the online survey anonymously and confidentially. A link is provided with the call to complete the survey with a specific deadline.
After the deadline, the survey site is closed, data analyzed, and a report is issued to the client college or university. To see an example of a typical report, see the example report below.
The Theoretical Model
Description
Conducting the Survey
The Survey Report
Project Fee
The Theoretical Model Underlying the Survey
The CWB measure we developed is based on two theoretical notions borrowed from quality-of-life research, namely bottom-up spillover and need satisfaction (see Sirgy, 2001, 2002 for literature reviews). Researchers have long recognized that the psychological life space is multi-dimensional. That is, people experience life events in relation to major activities (e.g., work, leisure, transportation, housing, dating, engaging in religious activities, shopping, eating, and socializing, among others). Affective responses to events related to any major activity are stored in a life domain reflecting that activity. For example, people react emotionally to many events related to driving their vehicles (major activity) and store the positive and negative affect in a life domain reflecting personal transportation. Within each life domain, positive affect is enhanced (and negative affect is reduced) with satisfaction of the full spectrum of human developmental needs. That is, satisfaction in a particular domain is maximized when the person experiences satisfaction in relation to safety, economic, family, social, esteem, actualization, knowledge, and aesthetics needs – the full spectrum of human developmental needs. The greater the need satisfaction, the more positive affect (the less negative affect) accumulates in that domain. For example, in the context of the personal transportation domain, satisfaction in the personal transportation domain is maximized when developmental needs – safety, economic, family, social, esteem, actualization, knowledge, and aesthetics needs – are satisfied over an extended period.
Domain satisfaction plays an important role in life satisfaction through a bottom-up spillover process. That is, the affect invested in life domains spills over to the most super-ordinate life domain that captures one’s perceptions and feelings about life in general. Thus, satisfaction in a specific domain such as personal transportation (in addition to affect invested in other life domains such as work, leisure, housing, dating, engaging in religious activities, shopping, eating, and socializing) contributes to feelings of life satisfaction, overall happiness, or subjective well being. Many quality-of-life studies have empirically demonstrated that life satisfaction can be explained and predicted from satisfaction one experiences within different life domains and that satisfaction with personal transportation does play a significant role in life satisfaction (e.g., Andrews and Withey, 1976; Campbell et al., 1976; Diener, 1984; Diener et al., 1999). See Figure 1 below.
Our theoretical approach to conceptualizing and measuring CWB in relation to personal transportation is based on the concept of need satisfaction developed by Maslow (1954), McClelland (1961), Herzberg (1966), and Alderfer (1972). The basic tenet of this approach to CWB is that people have needs they seek to fulfill through major activities that are segmented in life domains. In each life domain, people use specific products and services to facilitate their major activities and accomplish the goals related to those activities. In the context of the personal transportation life domain, a vehicle facilitates the personal transportation activity. The extent to which a consumer is satisfied with his vehicle is directly related to his or her investment of positive affect in the personal transportation domain. Specifically, satisfaction with the vehicle is a reflection of the extent to which the consumption of the vehicle meets the person’s developmental needs – safety, economic, family, social, esteem, actualization, knowledge, and aesthetics needs.
- Safety needs in relation to personal transportation are safety goals that consumers strive to attain such as protection from car accidents and bad weather. An example of a measurement item illustrating this need dimension is “I feel very safe in my car.”
- Economic needs in relation to personal transportation are financial goals consumers strive to attain such having a car that does not cost too much to operate (e.g., “My car is economical”).
- Family needs are goals focusing on family interests such as ensuring that the automobile has enough space for the family, and that the transportation needs of various family members are met (e.g., “My car satisfies my family needs”).
- Social needs reflect consumer goals of owning a car that elicits approval from family and friends (e.g., “My car meets my social needs.”) and social recognition by others (e.g., “The image of my car shows status and prestige to others”).
- Esteem needs are goals related to the reliability of the car enabling the owner to conduct his or her daily activities (e.g., “My car does not let me down when I use it for daily and weekly activities”).
- Actualization needs are symbolic goals related to the need of driving a car that expresses the identity of the driver (e.g., “My car reflects who I am”) and serves to approach an ideal self-image (e.g., “My car reflects who I would like to be”).
- Knowledge needs are goals related to having a car that enables one’s exploration of new places (e.g., “I use my car a lot to explore new places”).
- Aesthetics needs are goals related to owning a car that is considered aesthetically pleasing (e.g., “My car is beautiful, inside and out”).
![]()
References
Sirgy, M. J., Lee, D. J., & Kressmann, F. (2006). A need-based measure of consumer well being (CWB) in relation to personal transportation: Nomological validation. Social indicators research, 79(2), 337-367.
Bibliography
Fu, X. (2024). Intention-to-use low-carbon travel modes-An investigation integrating Maslow’s hierarchy of (driving) needs and the theory of planned behavior. Sustainable cities and Society, 101, 105187.
Hwang, J., & Han, H. (2014). Examining strategies for maximizing and utilizing brand prestige in the luxury cruise industry. Tourism management, 40, 244-259.
Lee, D. J., & Sirgy, M. J. (2011). Consumer well-Being (CWB): Various conceptualizations and measures. In Handbook of social indicators and quality of life research (pp. 331-354). Dordrecht: Springer Netherlands.
Mokhtarian, P. L., Salomon, I., & Singer, M. E. (2015). What moves us? An interdisciplinary exploration of reasons for traveling. Transport reviews, 35(3), 250-274.
Pancer, E., & Handelman, J. (2012). The evolution of consumer well‐being. Journal of Historical Research in Marketing, 4(1), 177-189.
Sauer, V., Mertens, A., Heitland, J., & Nitsch, V. (2019). Exploring the concept of passenger well-being in the context of automated driving. International Journal of Human Factors and Ergonomics, 6(3), 227-248.
Sirgy, M. J. (2008). Ethics and public policy implications of research on consumer well-being. Journal of Public Policy & Marketing, 27(2), 207-212.
Sirgy, M. J., Lee, D. J., & Rahtz, D. (2007). Research on consumer well-being (CWB): Overview of the field and introduction to the special issue. Journal of Macromarketing, 27(4), 341-349.
Spencer, P., Watts, R., Vivanco, L., Kaza, S., & Farley, J. (2014). Bicycles, Transportation Sustainability, and Quality of Life (No. UVM TRC Report# 14-001). University of Vermont. Transportation Research Center.
Xiao, J. J. (2015). Consumer economic wellbeing. In Consumer economic wellbeing (pp. 3-21). New York, NY: Springer New York.
Description of the Survey
|
|
I. VEHICLE SATISFACTION general satisfaction, need satisfaction, purchasing decision |
II. LIFE DOMAIN SATISFACTION work, finance, health, education, social life, leisure, spiritual life, culture, social status |
| III. LIFE SATISFACTION life in general |
IV. DEMOGRAPHICS age, gender, marital status, full-time vs. part-time employment, etc. |
People are introduced to the survey questionnaire via an email describing the objectives of the survey as aiming to assess the consumer well-being in their community. Participants are assured that their responses would remain confidential and anonymous.
The questionnaire consists of three major sections. The first section involves the core survey items. See exact items of this construct in the actual online survey questionnaire.
The second section focuses on measures of satisfaction with various life domains and life overall. See exact items of these constructs in the actual online survey questionnaire.
The last (third) section of the questionnaire contains demographic questions related to gender, age, educational level, years of service in current type of work, and years of service.
Conducting the Survey
The Management Institute for Quality-of-Life Studies (MIQOLS) provides assistance in conducting the survey (online). The survey is first adapted to the exact specification of the community in question. The adapted version of the survey is then posted on MIQOLS website for data collection. The client publicizes a call to their citizens to complete the online survey anonymously and confidentially. A link is provided with the call to complete the survey with a specific deadline.
After the deadline, the survey site is closed, data analyzed, and a report is issued to the client college or university. To see an example of a typical report, see the example report below.
The Theoretical Model
Description
Conducting the Survey
The Survey Report
Project Fee
The Theoretical Model Underlying the Survey
Sirgy et al. (2006) developed a measure that captures the perceived quality-of-life impact of the Internet. They theoretical notion guiding that measure was that consumers’ perception of impact of the Internet on their overall quality-of-life is determined by the extent to which the Internet impacts their consumer well-being, social well-being, work well-being, leisure well-being, education well-being, community well-being, sexual well-being, etc. In other words, the overall qualityof-life impact perception is determined by their overall perception of the impact of the Internet on their various life domains. In turn, within each of these life domains, consumers have perceptions of Internet benefits and costs. For example, in the context of consumer life, the perceived impact of the Internet on consumer wellbeing is determined by perceived benefits (e.g., buying products through the Internet is beneficial because there is no sales pressure from sales people, Internet shopping is very convenient, Internet shopping allows consumers to shop around more effectively, it allows consumers to locate the right product that matches their needs). The perceived impact of the Internet on consumer well-being is also determined by perceived costs (e.g., risk of deception, risk of ordering the wrong item, risk of fraud, lack of tangibility, delay of gratification, lack of customer service, SPAM, lack of security, lack of privacy, identity theft, and so on). Therefore, these perceptions of benefits and costs within a life domain determine the overall perception of impact of the Internet in that life domain.
The theoretical model used by Sirgy et al. (2006) to develop their measure of Internet well-being was used to develop our measure of cell-phone well being. In other words, consumers have positive and negative experiences with their cell phones in a variety of life domains, namely social life, leisure life, family life, education life, health & safety, love life, work life, and financial life. The perception of benefits and costs of cell phone within each life domain affects the perception of how the cell phone impacts the user’s well being in relation to that life domain. Similarly, the user’s perception of the overall quality-of-life impact of the cell phone is determined by the user’s perception of the cell phone’s impact in the various life domains (see Fig. 1).
The impact of cell phones on overall QOL is influenced by: (a) perceived cell phone impact on social life, (b) perceived cell phone impact on leisure life, (c) perceived cell phone impact on family life, (d) perceived cell phone impact on education life, (e) perceived cell phone impact on health and safety life, (f) perceived cell phone impact on love life, (f) perceived cell phone impact on work life, and (g) perceived cell phone impact on financial life.

References
Sirgy, M. J., Lee, D. J., Kamra, K., & Tidwell, J. (2007). Developing and validating a measure of consumer well-being in relation to cell phone use. Applied Research in Quality of Life, 2(2), 95-123.
Bibliography
Altintas, M. H., Gursakal, N., Kaufmann, H. R., Vrontis, D., & Isin, F. B. (2010). Always-on mobile phone behaviour impulsive and postmodern consumers. International Journal of Technology Marketing, 5(4), 328-344.
Grzeskowiak, S., Lee, D. J., Yu, G. B., & Sirgy, M. J. (2014). How do consumers perceive the quality-of-life impact of durable goods? A consumer well-being model based on the consumption life cycle. Applied Research in Quality of Life, 9(3), 683-709.
Hammond, J. (2020). Well-Being and Phones: A Review of the Literature.
Hollebeek, L. D., & Belk, R. (2021). Consumers’ technology-facilitated brand engagement and wellbeing: Positivist TAM/PERMA-vs. Consumer Culture Theory perspectives. International Journal of Research in Marketing, 38(2), 387-401.
Land, K. C., Michalos, A. C., & Sirgy, M. J. (Eds.). (2011). Handbook of social indicators and quality of life research. Springer Science & Business Media.
Lervik-Olsen, L., Fennis, B. M., & Andreassen, T. W. (2024). Compulsive social media use and disconnection anxiety: Predictors and markers of compulsive and addictive social media consumption. In The Darker Side of Social Media (pp. 31-49). Routledge.
Sirgy, M. J. (2021). Macromarketing metrics of consumer well-being: An update. Journal of Macromarketing, 41(1), 124-131.
Sirgy, M. J., Lee, D. J., Kamra, K., & Tidwell, J. (2008). What determines perceived quality-of-life impact of mobile phones? A model based on the consumption life cycle. Applied Research in Quality of Life, 3(4), 251-268.
Weismayer, C. (2022). Applied research in quality of life: A computational literature review. Applied Research in Quality of Life, 17(3), 1433-1458.
Description of the Survey
|
|
I. SOCIAL LIFE communication, style, camera, ring tones, text messaging |
II. LEISURE LIFE camera, internet, games, music |
| III. FAMILY LIFE picture sharing, staying in touch, consultation |
IV. EDUCATION LIFE consultation calls, text messaging, alarm, internet |
|
| V. HEALTH AND SAFETY emergency security, driving, phone overuse |
VI. LOVE LIFE keeping up, camera |
|
| VII. WORK LIFE conference call, camera, internet, contact |
VIII. FINANCIAL LIFE check stocks, banking, paying bills, cellphone cost |
|
| IX. LIFE DOMAIN SATISFACTION work, finance, health, education, social life, leisure, spiritual life, culture, social status |
X. LIFE SATISFACTION life in general |
|
| XI. DEMOGRAPHICS age, gender, marital status, full-time vs. part-time employment, etc. |
People are introduced to the survey questionnaire via an email describing the objectives of the survey as aiming to assess the consumer well-being in their community. Participants are assured that their responses would remain confidential and anonymous.
The questionnaire consists of three major sections. The first section involves the core survey items. See exact items of this construct in the actual online survey questionnaire.
The second section focuses on measures of satisfaction with various life domains and life overall. See exact items of these constructs in the actual online survey questionnaire.
The last (third) section of the questionnaire contains demographic questions related to gender, age, educational level, years of service in current type of work, and years of service.
Conducting the Survey
The Management Institute for Quality-of-Life Studies (MIQOLS) provides assistance in conducting the survey (online). The survey is first adapted to the exact specification of the community in question. The adapted version of the survey is then posted on MIQOLS website for data collection. The client publicizes a call to their citizens to complete the online survey anonymously and confidentially. A link is provided with the call to complete the survey with a specific deadline.
After the deadline, the survey site is closed, data analyzed, and a report is issued to the client college or university. To see an example of a typical report, see the example report below.
The Theoretical Model
Description
Conducting the Survey
The Survey Report
Project Fee
The Theoretical Model Underlying the Survey
Many scientists and scholars have acknowledged that the Internet does indeed influence the quality of life (e.g., Cairncross, 1997; Israel, 2000; DiMaggio et al., 2001). It does so by providing the user with a host of benefits in the context of many life domains (e.g., social life, work life, leisure life). The use of the Internet also adversely influences the quality of life of Internet users. As with Internet benefits, costs also could be identified in the context of various life domains. The perception of Internet benefits and costs within each life domain affects the perception of how the Internet impacts the user’s well being in relation to that life domain. Similarly, the user’s perception of the overall quality-of-life impact of the Internet is determined by the user’s perception of the Internet’s impact in the various life domains.
Behavioral scientists have long recognized that the psychological life space is multi-dimensional. People experience affective events and store those events in memory that is segmented by various life domains (e.g., work, leisure, family, health, community, neighborhood, home, consumer, financial, spiritual, social, and personal transportation). The affect invested in those life domains spills over to the most super-ordinate life domain that captures one’s perceptions and feelings about life overall (e.g., Andrews and Withey, 1976; Campbell et al., 1976; Diener, 1984; Sirgy, 2002). A number of quality-of-life studies have shown that life satisfaction can be explained and predicted from satisfaction one experiences within various life domains (e.g., Andrews and Withey, 1976; Campbell et al., 1976). For example, people may feel satisfied with life as a direct function of their satisfaction with their health, job, family, friends, community, material possessions, housing, and transportation, etc.
The perceived impact of the Internet in various life domains affects the perception of the role of the Internet on life overall (or life satisfaction). This has been demonstrated in a variety of other settings such as healthcare, television and entertainment, travel and tourism, work, transportation, shopping, housing, real estate, and community development (see Sirgy, 2001, 2002; Lee and Sirgy, 2005 for literature reviews). The underlying notion here is that overall life satisfaction is functionally related to satisfaction with all of life’s domains. That is, people’s feeling about life in general is very much influenced by how they feel about their life domains.
Many quality-of-life studies have empirically demonstrated how perceptions and evaluations in specific life domains influence perceptions and evaluations related to overall life. For example, Leelakulthanit et al. (1991) conducted a study demonstrating how perceptions and evaluations related to standard of living affects perceptions and evaluations related to life satisfaction. Sirgy et al. (1994) have demonstrated the same effect in relation to hospitals. Lee et al. (2002) showed how perceptions and evaluations related to consumer-related events in one’s community affect life satisfaction. We use the same logic to explain the perceived impact of the Internet in various life domains on the perceived impact of the Internet on life overall. What life domains are likely to be most significantly influenced by the Internet? Our review of the literature led us to believe that the Internet plays an important role in the following life domains: consumer life, work life, leisure life, education life, social life, community life, and sensual life (see Figure 1).

References
Sirgy, M. J., Lee, D. J., & Bae, J. (2006). Developing a measure of internet well-being: Nomological (predictive) validation. Social Indicators Research, 78(2), 205-249.
Bibliography
Akter, S., Mohiuddin Babu, M., Hossain, M. A., & Hani, U. (2021). How does value co-creation transform quality of life at the bottom of the pyramid?. Journal of Marketing Management, 37(9-10), 962-992.
Choi, H., Lee, M., Im, K. S., & Kim, J. (2007). Contribution to quality of life: A new outcome variable for mobile data service. Journal of the Association for Information Systems, 8(12), 36.
Cleveland, M., Iyer, R., & Babin, B. J. (2023). Social media usage, materialism and psychological well-being among immigrant consumers. Journal of Business Research, 155, 113419.
Cotten, S. R., Goldner, M., Hale, T. M., & Drentea, P. (2011). The importance of type, amount, and timing of internet use for understanding psychological distress. Social Science Quarterly, 92(1), 119-139.
Kim, J. J., Nam, M., & Kim, I. (2019). The effect of trust on value on travel websites: enhancing well-being and word-of-mouth among the elderly. Journal of Travel & Tourism Marketing, 36(1), 76-89.
Ko, H. C., & Chen, T. K. (2009, May). Understanding the continuous self-disclosure of bloggers from the cost-benefit perspective. In 2009 2nd Conference on Human System Interactions (pp. 520-527). IEEE.
Land, K. C., Michalos, A. C., & Sirgy, M. J. (Eds.). (2011). Handbook of social indicators and quality of life research. Springer Science & Business Media.
Lee, D. J., & Sirgy, M. J. (2011). Consumer well-Being (CWB): Various conceptualizations and measures. In Handbook of social indicators and quality of life research (pp. 331-354). Dordrecht: Springer Netherlands.
Liang, T. H. (2011). Association between use of Internet services and quality of life in Taiwan. Journal of Data Science, 9(1), 83-92.
Liang, T. H. (2011). Internet service cognition and use, and their promotion of quality of life in Taiwan. Social indicators research, 102(1), 99-110.
Lu, S., & Ahn, J. (2024). Assessment of job meaning based on attributes of food-delivery mobile applications. Current Issues in Tourism, 27(19), 3095-3114.
Malo-Cerrato, S. (2023). Children’s IT Use. In Encyclopedia of Quality of Life and Well-Being Research (pp. 1-9). Cham: Springer International Publishing.
Ong, C. S., & Lin, M. Y. C. (2016). Is being satisfied enough? Well-being and IT post-adoption behavior: An empirical study of Facebook. Information Development, 32(4), 1042-1054.
Rishi, B., & Agarwal, S. (2023). An unexpected journey: designing a framework to use social media for consumer well-being. In Dealing with Socially Responsible Consumers: Studies in Marketing (pp. 103-128). Singapore: Springer Nature Singapore.
Sarriera, J. C., Abs, D., Casas, F., & Bedin, L. M. (2012). Relations between media, perceived social support and personal well-being in adolescence. Social indicators research, 106(3), 545-561.
Sirgy, M. J. (2021). Macromarketing metrics of consumer well-being: An update. Journal of Macromarketing, 41(1), 124-131.
Sirgy, M. J., Lee, D. J., & Rahtz, D. (2007). Research on consumer well-being (CWB): Overview of the field and introduction to the special issue. Journal of Macromarketing, 27(4), 341-349.
Techatassanasoontorn, A. A., & Tanvisuth, A. (2010). IS use and quality of life: A conceptualization and empirical investigation. AIS Transactions on Human-Computer Interaction, 2(2), 26-54.
Wang, J., & Jia, X. (2023). Click it, and increase hedonic consumption ratio: How does online shopping improve the long‐term subjective well‐being of consumers?. Journal of Consumer Behaviour, 22(2), 235-252.
Wang, W., Wang, Y., Zhang, Y., & Ma, J. (2020). Spillover of workplace IT satisfaction onto job satisfaction: The roles of job fit and professional fit. International Journal of Information Management, 50, 341-352.
Description of the Survey
|
|
I. CONSUMER LIFE anonymity, convenience, shopping, fraud, advertising, privacy |
II. WORK LIFE flexibility, communication, information access |
| III. LEISURE LIFE information access, games, entertainment |
IV. SOCIAL LIFE communication |
|
| V. EDUCATION LIFE distance learning, information access |
VI. COMMUNITY LIFE information access, utility payment |
|
| VII. LIFE DOMAIN SATISFACTION work, finance, health, education, social life, leisure, spiritual life, culture, social status |
VIII. LIFE SATISFACTION life in general |
|
| IX. DEMOGRAPHICS age, gender, marital status, full-time vs. part-time employment, etc. |
People are introduced to the survey questionnaire via an email describing the objectives of the survey as aiming to assess the consumer well-being in their community. Participants are assured that their responses would remain confidential and anonymous.
The questionnaire consists of three major sections. The first section involves the core survey items. See exact items of this construct in the actual online survey questionnaire.
The second section focuses on measures of satisfaction with various life domains and life overall. See exact items of these constructs in the actual online survey questionnaire.
The last (third) section of the questionnaire contains demographic questions related to gender, age, educational level, years of service in current type of work, and years of service.
Conducting the Survey
The Management Institute for Quality-of-Life Studies (MIQOLS) provides assistance in conducting the survey (online). The survey is first adapted to the exact specification of the community in question. The adapted version of the survey is then posted on MIQOLS website for data collection. The client publicizes a call to their citizens to complete the online survey anonymously and confidentially. A link is provided with the call to complete the survey with a specific deadline.
After the deadline, the survey site is closed, data analyzed, and a report is issued to the client college or university. To see an example of a typical report, see the example report below.
The Theoretical Model
Description
Conducting the Survey
The Survey Report
Project Fee
The Theoretical Model Underlying the Survey
The overall general model can be represented as: Elderly life satisfaction = f(satisfaction in consumer life, satisfaction in other life domains). In this model three constructs are involved: life satisfaction, satisfaction in consumer life, and satisfaction in other life domains. Life satisfaction refers to an aggregate sense of well-being developed in response to personal and environmental influences. This aggregate sense of well-being is an attitude state or overall satisfaction resulting from satisfaction with a variety of life domains such as consumer life, family life, work life, leisure life, love life, spiritual life, financial life, and community life. One
particular life domain we are concerned about in this research is the consumer life domain and specifically satisfaction with consumer life. We call this construct overall consumer satisfaction. It is an attitude state representing level of fulfillment of wants or needs gained from experiential interactions with retail establishments in the local area.
The extent to which life satisfaction is influenced by overall consumer satisfaction and satisfaction in other life domains is traditionally explained using bottom-up spillover model, sometimes referred to as the “satisfaction hierarchy” in quality-of-life studies (e.g., Andrews and Withey 1976; Diener 1984; Diener et al. 1999; Sirgy 2001). Overall consumer satisfaction, in turn, represents an attitude determined by the individual’s reaction to marketing institutional influence and the value those institutions produce. Satisfaction in a given life domain, including consumer life, is determined by satisfaction with life events and concerns within that domain. For example, satisfaction in work life is affected by many life events at work such as how the person is treated by his or her supervisor, his or her co-workers, his or her level of compensation, dealing with customers, and so on. Similarly, satisfaction in consumer life is affected by experiences the consumer might have had at the grocery store, the clothing boutique, the sporting goods store, among others.
Next, we have to develop a conceptual scheme to capture a large array of marketing institutions that elderly consumers have repeated experiences with. Examples of these institutions include advertisers, the media, wholesalers, and retailers. One can argue that elderly’s interactions with marketing institutions typically and quite often are mediated through interactions with retailers in the local area. In other words, retail establishments found at the local level is the “face” of marketing institutions, and elderly’s feelings about the marketing institution can be, for the most part, captured through expressed feelings with local retailers. Thus, we searched for a comprehensive listing or taxonomy of retail institutions. One source was a taxonomy developed by the U.S. Bureau of Labor Statistics called the Consumer Expenditure Survey. This publication is issued periodically and contains 11 categories of products/services typically purchased by consumers in the U.S. These are: (1) food, (2) housing, (3) household operations, (4) household furnishings, (5) clothing and accessories, (6) personal care, (7) medical care, (8) recreation, (9) transportation, (10) education, and (11) other. To generate an array of representative retail institutions, retailer types were developed that are judged to most likely sell the type of products/services. This taxonomy of retailers is shown in Table 1. These categories of retail institutions that determine overall consumer satisfaction are referred to as consumer sub-domains. The resultant taxonomy involved 37 different types of retail establishments and services found in a typical community or local area. The key to the retail structure shown in the table is that each sub-domain contains institutions that have distinct organizations, clients, and products, broadly defined. The logic for such a sub-domain structure of overall consumer satisfaction is consistent with Andrew and Withey’s life domain structure. Based on this consumer sub-domain structure, the next step was to develop an attitude measure that captures post-interactive satisfaction resulting from each retail sub-domain, thus allowing for a composite attitude indicator of overall consumer satisfaction to be formed.

References
Meadow, H. L., & Sirgy, M. J. (2008). Developing a measure that captures elderly’s well-being in local marketplace transactions. Applied Research in Quality of Life, 3(1), 63-80.
Bibliography
Andreasen, A. R., Goldberg, M. E., & Sirgy, M. J. (2012). Foundational research on consumer welfare: Opportunities for a transformative consumer research agenda. In Transformative consumer research for personal and collective well-being (pp. 25-65). Routledge.
Dogra, N., Nasir, M., & Adil, M. (2023). Does shopping values influence consumers’ well-being: empirical evidence from e-retail. International Journal of Retail & Distribution Management, 51(12), 1698-1718.
Ekici, A., Joseph Sirgy, M., Lee, D. J., Yu, G. B., & Bosnjak, M. (2018). The effects of shopping well-being and shopping ill-being on consumer life satisfaction. Applied Research in Quality of Life, 13(2), 333-353.
El Hedhli, K., Becheur, I., Zourrig, H., & Chaouali, W. (2021). Shopping well-being: the role of congruity and shoppers’ characteristics. Journal of Consumer Marketing, 38(3), 293-304.
El Hedhli, K., Chebat, J. C., & Sirgy, M. J. (2013). Shopping well-being at the mall: Construct, antecedents, and consequences. Journal of business research, 66(7), 856-863.
El Hedhli, K., Zourrig, H., & Chebat, J. C. (2016). Shopping well-being: Is it just a matter of pleasure or doing the task? The role of shopper’s gender and self-congruity. Journal of Retailing and Consumer Services, 31, 1-13.
Gentry, J. W., & Mittelstaedt, R. A. (2017). The rapidly aging world: Implications for marketing. Global business review, 18(3_suppl), S1-S18.
Grzeskowiak, S., Sirgy, M. J., Foscht, T., & Swoboda, B. (2016). Linking retailing experiences with life satisfaction: The concept of story-type congruity with shopper’s identity. International Journal of Retail & Distribution Management, 44(2), 124-138.
Kim, I., Mi Jeon, S., & Sean Hyun, S. (2012). Chain restaurant patrons’ well‐being perception and dining intentions: The moderating role of involvement. International Journal of Contemporary Hospitality Management, 24(3), 402-429.
Lee, D. J., & Sirgy, M. J. (2011). Consumer well-Being (CWB): Various conceptualizations and measures. In Handbook of social indicators and quality of life research (pp. 331-354). Dordrecht: Springer Netherlands.
Sirgy, M. J. (2012). Material Well-Being. In The Psychology of Quality of Life: Hedonic Well-Being, Life Satisfaction, and Eudaimonia (pp. 325-351). Dordrecht: Springer Netherlands.
Sirgy, M. J. (2018). The psychology of material well-being. Applied Research in Quality of Life, 13(2), 273-301.
Sirgy, M. J. (2019). What determines subjective material well-being?. In Wealth (s) and subjective well-being (pp. 51-66). Cham: Springer International Publishing.
Sirgy, M. J. (2021). Macromarketing metrics of consumer well-being: An update. Journal of Macromarketing, 41(1), 124-131.
Sirgy, M. J., Lee, D. J., & Yu, G. B. (2020). Shopping-life balance: Towards a unifying framework. Applied Research in Quality of Life, 15(1), 17-34.
Description of the Survey
|
|
I. RETAIL INSTITUTIONS food, housing, household operations, household furnishings, clothing and accessories, personal care, medical care, recreation, transportation, education, etc. |
II. LIFE DOMAIN SATISFACTION work, finance, health, education, social life, leisure, spiritual life, culture, social status |
| III. LIFE SATISFACTION life in general |
IV. DEMOGRAPHICS age, gender, marital status, full-time vs. part-time employment, etc. |
People are introduced to the survey questionnaire via an email describing the objectives of the survey as aiming to assess the consumer well-being in their community. Participants are assured that their responses would remain confidential and anonymous.
The questionnaire consists of three major sections. The first section involves the core survey items. See exact items of this construct in the actual online survey questionnaire.
The second section focuses on measures of satisfaction with various life domains and life overall. See exact items of these constructs in the actual online survey questionnaire.
The last (third) section of the questionnaire contains demographic questions related to gender, age, educational level, years of service in current type of work, and years of service.
Conducting the Survey
The Management Institute for Quality-of-Life Studies (MIQOLS) provides assistance in conducting the survey (online). The survey is first adapted to the exact specification of the community in question. The adapted version of the survey is then posted on MIQOLS website for data collection. The client publicizes a call to their citizens to complete the online survey anonymously and confidentially. A link is provided with the call to complete the survey with a specific deadline.
After the deadline, the survey site is closed, data analyzed, and a report is issued to the client college or university. To see an example of a typical report, see the example report below.
The Survey Report

After the survey has been completed you will receive an Excel data file containing the survey data plus statistical norms for every survey item. A convenient summary sheet will be provided to quickly gauge the responses for each survey question, as well as the computed averages for important question sets.
- Data: The raw data containing the results from the survey.
- Summary: A sheet which summarizes the survey responses.
If the spreadsheet provided is insufficient for your needs, you may also want to consider asking MIQOLS to produce an official report. Official reports can provide not only an analysis and visualization (in the form of charts and graphs) for each survey item, but also further analysis with respect to specific demographics of interest.
The production of an official report varies greatly depending on the specific needs of clients. If you are interested in pursuing this option, please contact us (office@miqols.org) to discuss in detail your requirements.

The report is structured as follows:
- Cover page: A title page with applicant contact information and MIQOLS contact information
- Executive Summary: The entire content of the report is summarized here.
- Theory and Model: The theoretical model underlying the survey is described here and the theoretical constructs are clearly defined. The research supporting the model is also discussed in this section.
- Description of the Survey: This section contains a description of the constructs with corresponding survey items.
- Sampling and Data Collection: This part of the report describes the call issued to people to participate in the survey, the deadline imposed, any incentives used to encourage participation, the survey link, the number of people who actually participated in the survey, the total number of people contacted, and the response rate. The response rate is compared to past response rates.
- Survey Results: This section of the report provides descriptive statistics related to each survey item with figures (e.g., bar charts) against the norm. The norm is calculated based on the average of all past surveys that have been administered through MIQOLS.
- Discussion and Recommendations: The survey results are then summarized and interpreted in this section. As such, specific strengths and weaknesses are identified.
- References: Exact references of corresponding text citations are fleshed out in this section.
- Appendices: Extra detailed information related to any aspect of the report is placed in this section.
Example Reports
- Community-Quality-of-Life Example Report
- Consumer-Wellbeing Example Report
- Quality-of-College-Life Example Report
- Quality-of-Community-Healthcare Example Report
- Quality-of-Work-Life Example Report
Project Fee
$1000 to help set up the survey site for your data collection (guided by the validated survey measures). After the completion of data collection, we will deliver an Excel data file containing the survey data plus statistical norms for every survey item. If you would like a full report with charts and recommendations, you can contact our office to discuss in detail your requirements and the corresponding payment.
To request MIQOLS to conduct a Consumer Wellbeing SurveyShopping Wellbeing SurveyMall Image SurveyHousing Wellbeing SurveyPerceived Product Quality-of-Life Impact SurveySatisfaction with Personal Transportation SurveySatisfaction with Mobile Phone and Services SurveySatisfaction with Internet Services SurveySatisfaction with Retail Institutions Survey, please send an e-mail message to the executive director of MIQOLS, Joe Sirgy, at office@miqols.org indicating interest. You can also contact MIQOLS by letter (address: 6020 Lyons Road, Dublin, Virginia 24084, USA) or by phone (540-674-5022; leave voicemail message). A staff member will contact you by e-mail to set up a telephone (or Skype or ZOOM) meeting. The staff member will answer whatever questions you may have and discuss the logistics of the entire project, the cost, survey specifications, time line, delivery of the survey report and other details.